Patient Survival - Adult
At its most basic, saving lives is what quality hospital care is all about. Severely ill or injured people come to our hospitals every day in search of help, and we pride ourselves on being able to provide it.
Not every life can be saved, however, but helping people when the odds are against them is what we’re here for. We do this by providing advanced technology, a highly trained medical team and processes that are continually being reviewed and improved.
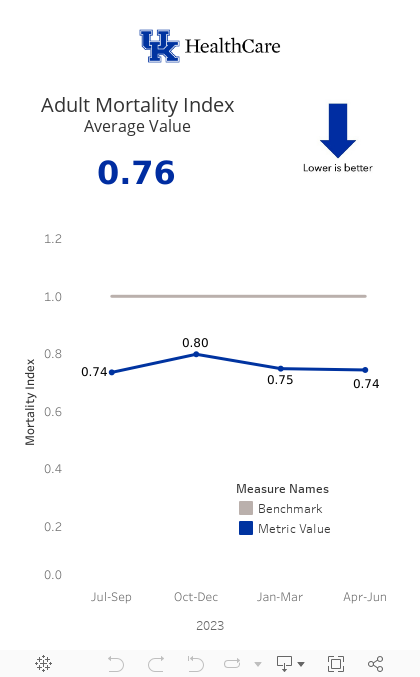
Adult Mortality Index
Source: Data from the Vizient Clinical Data Base/Resource Manager™ used by permission of Vizient. All rights reserved. Vizient is an alliance of more than 100 leading university hospitals.
Understanding the Vizient mortality index (lower is better)
Academic health systems such as UK HealthCare take care of the very sickest patients. That’s why patient survival rates are adjusted to account for just how sick the patients are when they come to the hospital. Taken into account are the seriousness of a patient’s illness plus complicating factors like age, obesity, diabetes or heart failure.
Observed-to-expected mortality (death) compares two numbers:
- Observed mortality is the actual number of patients admitted to the hospital who died during a particular period. For example, 10 deaths among 1,000 patients would be a rate of 1 percent.
- Some people are so sick they are not reasonably expected to survive. More of these patients are seen at places like UK HealthCare because health systems like ours are better equipped to help.
Expected mortality adjusts for how sick patients are compared with patients seen at other U.S. hospitals.
To reach the final number, the observed rate is divided by the expected rate, meaning that the number of actual deaths is compared with how many people were so sick that they were not expected to live.
A score of 1.00 would mean exactly the same number of patients who might have been expected to die did in fact die. A score higher than 1.00 means more patients died than were statistically expected to.
For instance, a mortality index of 1.10 would mean 10 percent of people who were expected to survive did not. A score lower than 1.00 means that more patients survived than were statistically expected to. For instance, if the ratio is .75, it means that for every 100 people expected to die, only 75 actually did. Twenty-five of those very sick people survived.
Who figures these rates?
These rates are figured by Vizient, an alliance of academic medical centers and their affiliated hospitals representing about 90 percent of the nation’s not-for-profit academic medical centers. Vizient performs risk-adjustment calculations for all hospitals and provides reports to the participating hospitals. These numbers are used by hospitals nationwide.
Medicare quality measures
Medicare calculates measurements for hospitals that address complications and death rates. The mortality data provided by the Centers for Medicare & Medicaid Services (CMS) offers more information about UK HealthCare’s quality performance, showing how our hospital compares nationally.